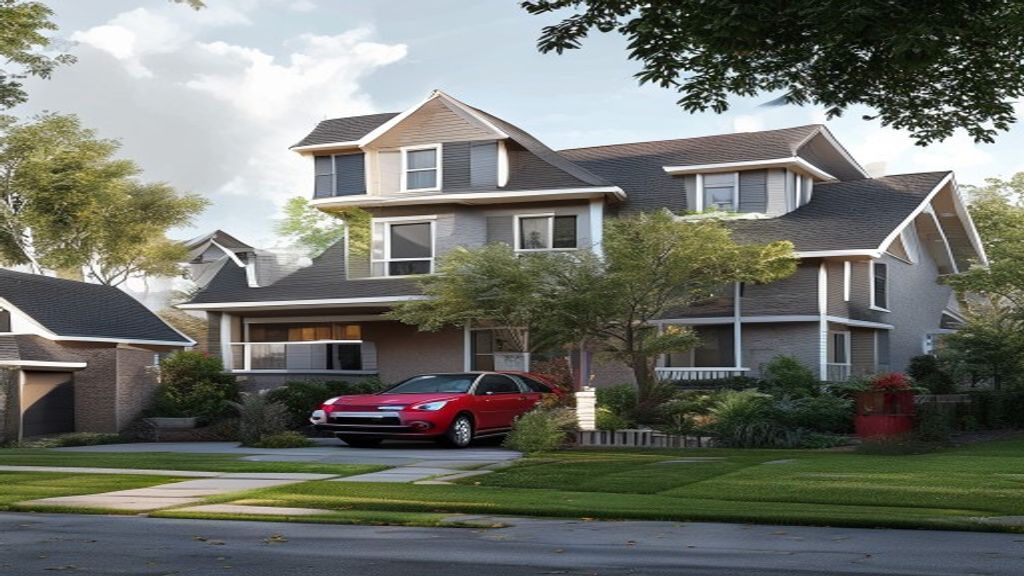
Finding the Right Home Starts with the Right Neighborhood
You’ve scrolled through countless listings, saved a handful of favorites, and maybe even imagined a new address on the map. Still, something feels off. The missing piece is often the neighborhood itself—its vibe, convenience, and long‑term promise. Before you fall in love with a façade, let’s make sure the surrounding community aligns with the lifestyle you’ve been picturing. The following tips give you a quick‑check toolkit that blends data, intuition, and a dash of street‑level savvy so you can zero in on the places that truly feel like home.
1. Unlock Your Ideal Locale: How to Pinpoint the Best Neighborhoods for Residential Homes for Sale
Start with a lifestyle inventory – write down the top three daily priorities (e.g., short commute, kid‑friendly parks, nightlife). This simple list becomes the compass for every data point you’ll explore.
Key tools and data sources
- City‑level dashboards (e.g., local government open data portals) – offer median income, housing turnover, and vacancy rates.
- Neighborhood‑specific platforms such as NeighborhoodScout or Niche – aggregate crime stats, school ratings, and growth trends in one view.
- Social‑media pulse – Instagram location tags or community Facebook groups reveal how residents talk about their area, flagging hidden gems or recurring complaints.
Quick‑check criteria
| Criterion | Why it matters | Fast way to verify |
|———–|—————-|——————–|
| Commute time | Directly affects daily stress and fuel costs | Use Google Maps “Leave now” to test peak‑hour routes from the prospective address to your workplace. |
| Affordability gap | Determines if you’ll be stretching financially or have room for upgrades | Compare the median home price with the median household income; a ratio below 3 generally signals balance. |
| Future development | Signals potential appreciation or construction disruption | Scan the city’s planning department site for approved projects within a 2‑mile radius. |
By layering these factual checks with your personal priorities, you can narrow a sprawling metro area to a handful of neighborhoods that genuinely fit the life you envision.
2. Map‑Based Hunting: Using Interactive Maps to Spot Hot Listings in Real Time
Step 1 – Pull the base map
Open Google Maps, switch to “Satellite” view, and zoom to the zip code of interest. Satellite imagery instantly reveals lot sizes, tree canopy, and whether a street feels busy or quiet.
Step 2 – Layer MLS data
Most multiple‑listing services (MLS) now offer a public overlay map. On sites like Redfin or Zillow, toggle “Map View” and enable the “New Listings” filter. This paints the market’s pulse in bright pins, letting you spot clusters of recent activity.
Step 3 – Add a mobility filter
Download a free app such as Walk Score or Transit App. Input the address you’re eyeing, and the app will colour‑code walkability, bike routes, and nearby transit stops. High scores often correlate with higher resale value and lower long‑term transportation costs.
Step 4 – Set price‑per‑square‑foot alerts
Within the MLS overlay, enable a custom column that calculates price per sq‑ft. Create a threshold (e.g., $150–$200 per sq‑ft) and set an email alert. When a listing breaches that band, you’ll receive a push notification before the majority of buyers even notice it.
Step 5 – Verify on the ground
Once a pin catches your eye, drop a pin in Google Street View and take a virtual stroll. Notice the condition of neighboring homes, the presence of sidewalks, and any signs of ongoing construction. A quick visual check can save hours of in‑person tours later.
By treating the map as a live dashboard rather than a static backdrop, you turn neighborhood hunting into a proactive, data‑driven hunt—one that surfaces hot listings the moment they appear.
3. Budget‑Friendly Filters: Narrowing Down Residential Homes for Sale Within Your Price Range
When the map shows a flood of pins, the first thing most buyers do is slam the price slider. But a savvy shopper goes a step further and builds a “budget envelope” that captures hidden costs as well as the headline price.
- Set a realistic price band – Start with the maximum mortgage you can comfortably service (most lenders suggest no more than 28 % of gross monthly income). Then subtract an estimated 2‑3 % for closing fees, property taxes, and homeowner’s insurance. This gives you a “true‑cost ceiling” that prevents surprise overages later.
- Factor in the price‑per‑square‑foot sanity check – As you saw in Step 4 of the map‑based hunt, a range of $150–$200 per sq‑ft is a common benchmark in many midsize metros. If a listing spikes to $250 per sq‑ft, ask yourself whether the extra square footage or a premium location justifies the jump.
- Include routine upkeep in the equation – Older homes often come with lower list prices but higher repair bills. A quick “30‑day renovation estimate” (e.g., $5 k for a new roof, $3 k for HVAC) can be added to your budget envelope, turning a potentially risky find into a well‑priced opportunity.
By layering these filters, you’ll watch the map’s sea of pins shrink to a handful of nice homes for sale that truly fit your pocket. The result is a curated list that you can review with confidence, rather than a scattershot chase that wastes time and energy.
4. School‑Zone Secrets: Why Nearby Schools Can Make or Break a Home’s Value
Even if you don’t have children, the quality of nearby schools is a silent driver of resale value in most residential home sales markets. A property sitting inside a high‑rated district often commands a premium of 5‑15 % over comparable homes just outside the zone.
- Quickly check school ratings – Websites such as GreatSchools.org or the state’s Department of Education portal let you enter an address and see a one‑to‑five star rating, test scores, and parent reviews within seconds.
- Map commute times – Plug the school’s address into Google Maps and select “depart at 7:30 am” to see realistic driving or bus routes. A commute longer than 30 minutes can be a deal‑breaker for families, and it also signals potential traffic congestion that may affect future resale.
- Watch for district plans – Local school board minutes (often posted on municipal websites) reveal upcoming boundary changes, new elementary schools, or bond measures for facility upgrades. An upcoming school construction project can boost property desirability, but it may also mean temporary construction noise—something to weigh in your decision.
A practical way to test the impact is to pull two comparable listings—one inside a top‑rated zone and one just outside—and compare their asking prices. You’ll frequently see the “inside” property priced a few thousand dollars higher, even when square footage and lot size are nearly identical. Armed with this insight, you can decide whether the extra cost is worth the peace of mind (or future equity) it brings.
Also Read: How New Build Houses Cut Energy Bills by Up to 30%